SaaS SEO Guide
SaaS keyword research tips and methods to ace the SERPs
Book a FREE SEO Strategy Consultation >
Further Reading:
- SaaS SEO Strategy
- SaaS SEO Checklist
- SaaS Technical SEO
- SaaS SEO Audit
- SaaS Keyword Research
- SaaS SEO Content
- SaaS SEO Copywriting
- E-A-T for SaaS
- Enterprise SaaS SEO
- SaaS SEO Metrics and KPI's
- SaaS SEO Attribution
- VOIP and Telecommunications SEO Strategy
- SaaS Link Building
- Payroll and Finance SaaS SEO
- SaaS SEO Agency
- SaaS Link Building Agency
If you’re looking for tips on how to carry out SaaS keyword research, you’re in the right place. We’re going to explore what it is, how to do it, and how to use it to achieve spectacular results for your business.
What is SaaS keyword research?
Keyword analysis and research is all about discovering the words and phrases that your potential customers are searching for online. The ultimate goal is to use this knowledge to optimize your website—and specific pages on it—so that links to them appear as high as possible on the first page of the search engine results page (SERP).
A keyword doesn’t have to be a single word. Theoretically, it can be a phrase of any length, but in practice, the more words you add, the fewer people will be searching for exactly that term. Usually, that places a practical limit on the length of the phrases you research.
On the other hand, if you only choose short, generic phrases like “fast car”, then you’ll face a different set of problems.
First, a phrase like this is so vague that it doesn’t say much about the searcher’s intent. Maybe they’re looking to buy a fast car, yes. But maybe they’re looking for a video of the old Tracy Chapman song or are interested in the latest news from the F1 season.
The other problem with choosing short and unspecific keywords is that there’s likely to be a lot of competition to rank for them.
Overall, then, the key is to strike a balance. You want keywords that are specific enough that they’re directly applicable to your offering but not so detailed that hardly anyone searches for them. SEO experts use multiple tried and tested keyword research techniques to find the gems in the rubble.
When it comes to keyword research for SaaS businesses, there’s an additional complication.
You see, unlike a sector like ecommerce, SaaS tends to operate with long sales cycles. It’s not uncommon for a B2B client to take six months or more to travel the full way down the SaaS sales funnel and convert.
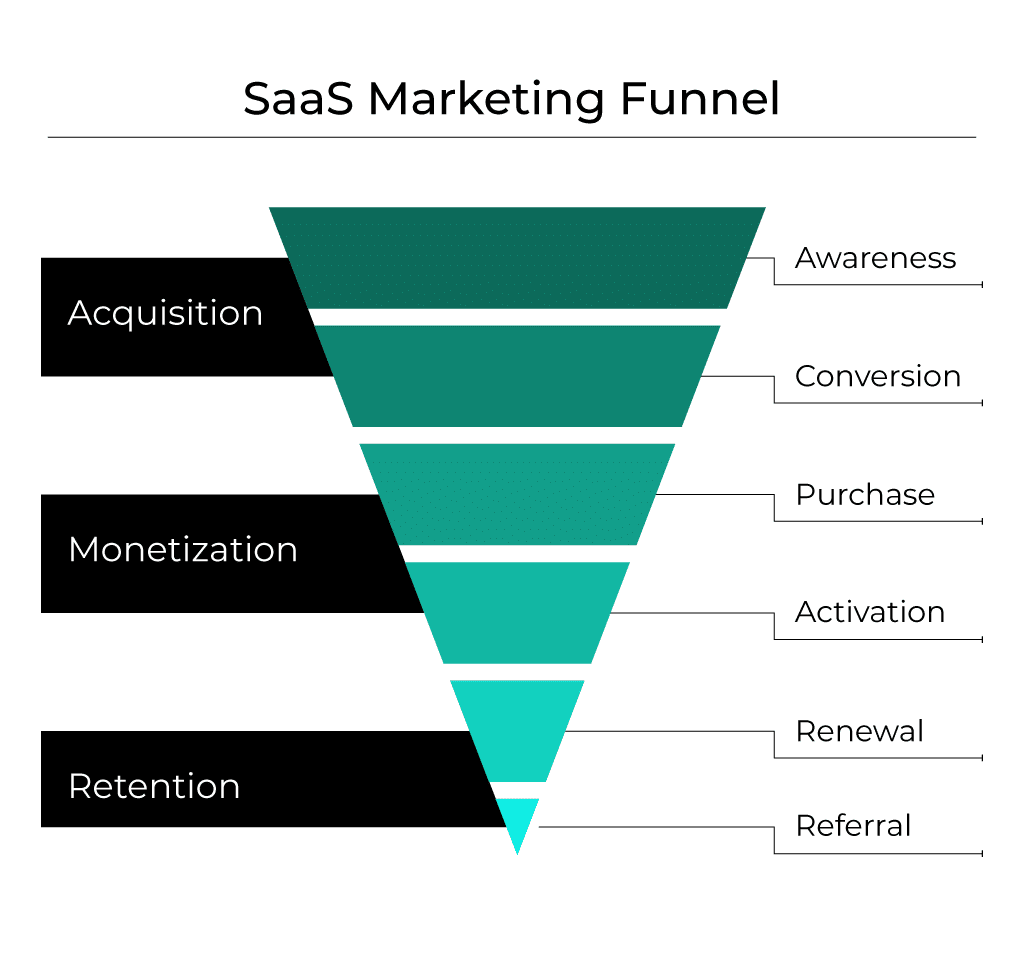
This means that SaaS SEO metrics tend to be calibrated a little differently to those used in other fields of business. Essentially, you need to target different keywords at different stages of the funnel. That’s how you maximize the impact of your message all the way through and get results.
So let’s dig into a bit more detail on how to conduct SERPs keyword research for SaaS campaigns.
Performing SaaS keyword research
There are five main steps in the SaaS keyword research process:
Step 1: Keyword gathering
First up is keyword gathering. At this point, what you’re doing is brainstorming some ideas. You’re looking for high search traffic keywords that are directly relevant to your business.
Basically, you build up a long list of potential keywords so you can sort through them later and narrow the field down to the most promising options.
One of the most common keyword research methods used during the gathering stage is competitor analysis.
This involves finding content that is already ranking well for the kinds of topics you want to compete on, and using an SEO tool to establish which keywords it targets. You then use this as a basis on which to build your own list.
This isn’t generally enough on its own, so you’ll need to do some manual keyword research as well. This approach takes longer, but is a great way of uncovering valuable possibilities.
You’ll begin by considering topic clusters. You have to think about what kind of content you need to produce to attract the right kind of clients. Then, you come up with possible keywords using a number of avenues such as:
- Thinking of related questions you might ask yourself
- Trying Google suggestions and “people also ask” sections related to your topics
- Thinking about whether there are any relevant seasonal trends
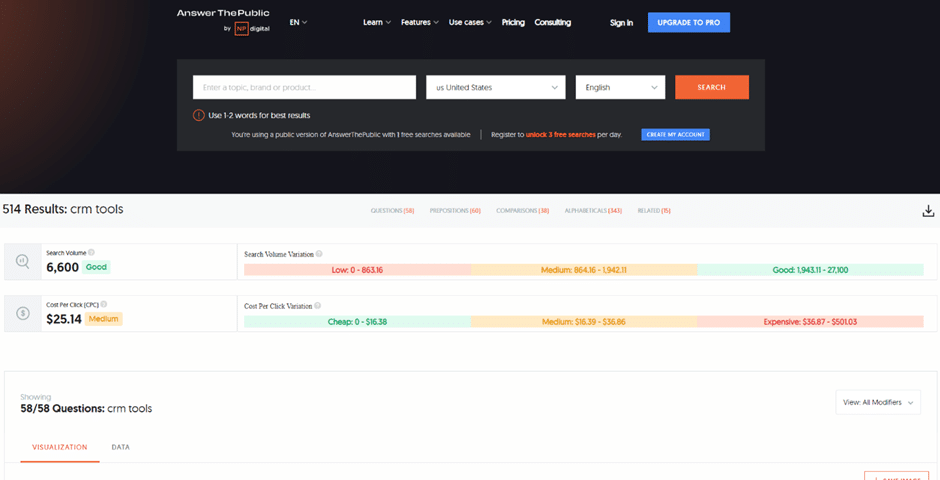
- Using an SEO tool like Answer the Public to generate fresh ideas
Step 2: Deciding on head term or secondary term
Once you have your list, it’s time to sort your keywords into metaphorical piles. You’re aiming to find what are called head terms, in other words main keywords that are the most important to target.
First, group your keywords together by topic or query. Keywords about related topics or queries should go in the same group. If you find that two of the queries are identical in meaning, check which one has the highest search volume. Keep that one, and put the other one aside, maybe into a potential secondary keyword pile.
Then, run through your list entry by entry and check each one to see whether it’s ranking on SERPs. Be careful to do this search using an incognito window, or else your own search history will affect the rankings.
Notice which queries have unique SERPs, because those are good candidates for creating a unique piece of content around. On the other hand, if you find more than one query generating the same results, you’ll only need to use a single piece of content to cover all of them. Check the search volume and cost per click of each one to find the best option, then ditch the rest.
Step 3: Keyword prioritization
Now you have a list of main keywords, the next thing to do is to decide which ones to work with first. This will only apply if you have a long list, of course. If your list is relatively brief, you may find it’s possible to use them all in a single batch of content creation.
Assuming that’s not the case, though, you’ll need to make some judgment calls. First of all, choose the head terms that are most relevant to the areas of strategy you’re currently prioritizing. Put them right at the top of the list.
Beyond that, there are a number of criteria you can use to select the order you’re going to use the keywords:
- Check the keywords’ traffic and deprioritize any that have a low search volume
- Organize by CPC
- Focus on bottom, middle, or top of the funnel keywords according to your current business plans
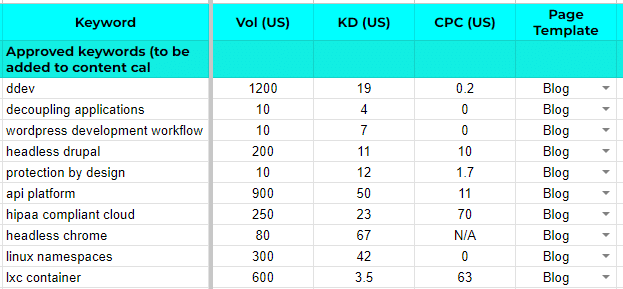
You’ll end up with a ranked list of head terms you can use alongside your SaaS SEO checklist to start planning your content calendar.
This means that SaaS SEO metrics tend to be calibrated a little differently to those used in other fields of business. Essentially, you need to target different keywords at different stages of the funnel. That’s how you maximize the impact of your message all the way through and get results.
So let’s dig into a bit more detail on how to conduct SERPs keyword research for SaaS campaigns.
Step 4: Keyword mapping
Hold your horses, though. Before you leap straight into creating new content, it’s crucial to check whether any of your pages are already ranking for your chosen keywords.
There are two reasons why this is the case. First, there’s no point creating brand new content if you could simply edit one of your existing pages to optimize it and give it a nudge up the rankings.
And, second, you don’t want to be in a position where two of your pages are competing to rank for the same keyword. Google may not be sure which one to give priority to, and both pages might struggle to rank well in that scenario.
This is where keyword mapping comes in. Essentially, it just means carrying out some checks to see whether any of your pages are already ranking for particular keywords.
If you find pages that are already ranking well, just give them an optimization tweak, and that should be enough for them to do even better.
In the case of pages that are ranking but not very highly, you need to have a closer look. It could be that the page is actually focused on a different topic and your keyword features as a secondary keyword rather than a head term there.
Often, the best course of action to take here is to create new content for your head term and link to it from the first page.
Keyword opportunity
You may have seen the term keyword opportunity popping up in SEO circles. This refers to the process of comparing a page’s current rankings to the estimated search volume and competition it would achieve after optimization. Thereby determining the degree of improvement possible.
Using keyword opportunity data is an integral part of an optimal keyword mapping strategy.
Step 5: Page level keyword research
Finally, you can fine-tune your strategy using page-level keyword research. This involves researching individual existing pages in more detail to identify opportunities.
This can include:
- Finding SERPs with weak results
- Examining the competition’s content
- Analyzing search volume at a granular level to uncover new options
The main goal is to make sure the keyword you’re targeting is the most appropriate one for the content you’re creating. It’s important to find out whether the page you’re creating might also rank for other keywords around the same topic.
Keyword research tips for your SaaS business
There are a number of approaches you can take to get the most out of your SaaS keyword research.
Here are two of our top tips:
Understand the buyer’s journey and keywords for SEO: As already mentioned, it’s crucial to target the right keywords for the right moment in the buyer’s journey because of the length of the SaaS sales cycle. Typically, awareness-stage content like blog posts can focus on general terms, as at this point, it’s all about making potential customers aware of your company’s offering.
On the other hand, when you’re creating content for qualified leads to consume, such as product pages or competitor comparison pages, you should be focusing more on keywords that will encourage conversion.
This could mean terms like “[your product] pricing” or “[your product] vs [competitor]”. Also target transactional keywords. These are terms typically searched for by people about to make a purchase such as “purchase…” or “where to buy…”
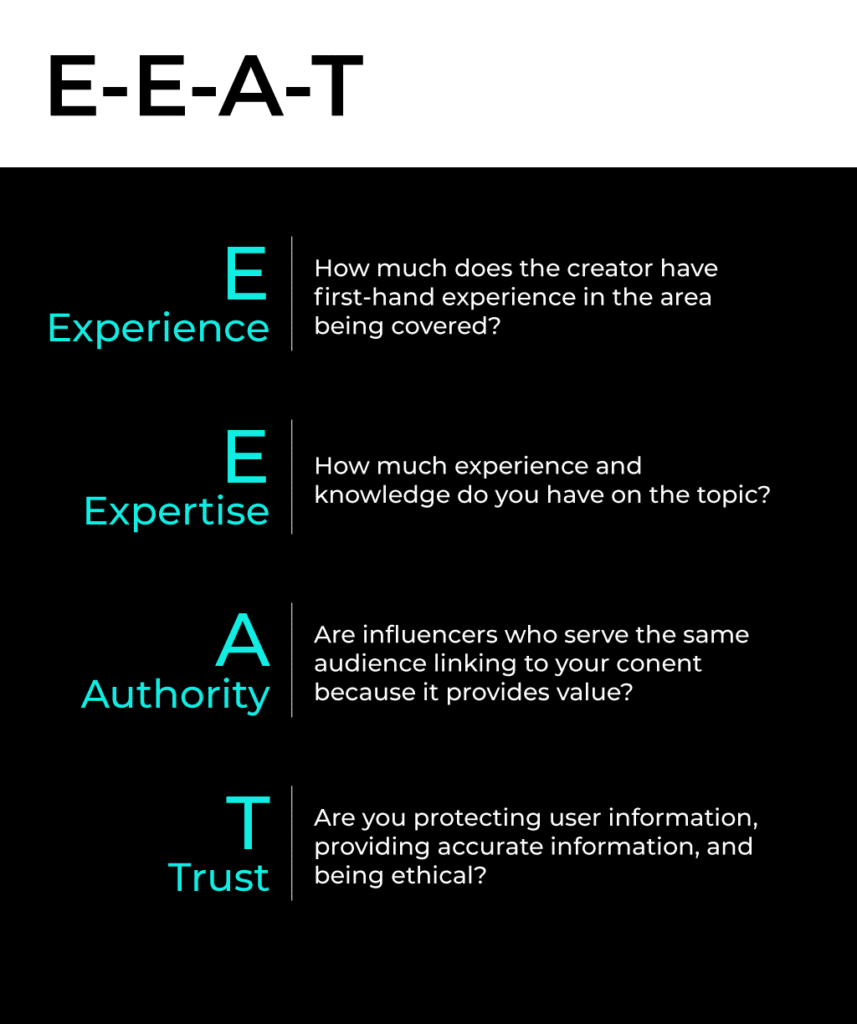
Don’t forget to E-A-T: E-A-T for SaaS companies means making sure Google rates your content highly for Expertise, Authority, and Trust within your niche. Since late 2022, a fourth criterion—Experience—has been added, so this should more properly be called E-E-A-T, but old habits die hard, particularly when they form such a good acronym.
Google has a search quality rating team that assesses websites on these criteria. It’s important to consider them when creating your content, because pages that score highly tend to rank higher on SERPs.
Implementing a content marketing strategy
So, you’ve done your keyword research, and you’ve established the main and secondary terms you’re going to target. How do you actually create the content?
The best approach is to mark all of your planned content down on a content calendar. This makes it easy to track the content as it’s produced and make sure it’s uploaded on time.
While the content is being created, continue to analyze the competition for other criteria, such as how many links they have on their pages and how quickly they’re being added. This puts you in a terrific position to react quickly and adapt your strategy to any sudden changes.
SaaS keyword research tool examples to simplify the process
Although this process might seem complex, help is at hand. There are many excellent tools available to help you in your page and website keyword quest. In our opinion, the two most useful are Google Search Console and Ahrefs.
The big advantage of using Google Search Console is that you get data straight from the source. Since it will be giving you information about genuine search queries, it’s highly accurate. This makes it pretty much unique as a resource.
Ahrefs is also worth using because of its depth. It’ll provide you with lots of information and has a plethora of useful features. This makes it ideal for tasks like fine-tuning your keywords using relevant keyword modifiers to make your primary keywords more specific.
Target the right SaaS keyword with research and analysis
Whatever your content strategy, finding the right SaaS keywords is essential to achieving success and hitting your conversion targets.
At accelerate agency, we have years of experience of working hand in hand with SaaS clients to create impact. What we’ve covered here is just a taster.
If you’d like more advice on how to take your content strategy to the next level using the most advanced SaaS keyword research and analysis techniques, we’d be delighted to help.