SaaS SEO Guide
Leaders & losers in marketing SaaS SEO
Book a FREE SEO Strategy Consultation >
Further Reading:
- SaaS SEO Strategy
- SaaS SEO Checklist
- SaaS Technical SEO
- SaaS SEO Audit
- SaaS Keyword Research
- SaaS SEO Content
- SaaS SEO Copywriting
- E-A-T for SaaS
- Enterprise SaaS SEO
- SaaS SEO Metrics and KPI's
- SaaS SEO Attribution
- VOIP and Telecommunications SEO Strategy
- SaaS Link Building
- Payroll and Finance SaaS SEO
- SaaS SEO Agency
- SaaS Link Building Agency
When you’re selling marketing software products, you better have a good handle on your own marketing efforts. Part of that involves keeping tabs on your competitors, and finding out how they’re using SEO to their advantage.
One way to do this is to use a Share of Value graph to visualize the competition and discover how they’re getting traffic for relevant keywords. We’re going to take a closer look at what Share of Value means and how it can inform your SEO strategy.
Introduction to marketing SaaS
Marketing SaaS describes marketing software solutions sold “as a service” and accessed via the internet instead of an on-premises system. The vendor (who owns the software) takes care of all maintenance, for a subscription fee paid monthly or yearly.
Some products are single marketing applications while others are integrated suites with multiple applications in one package. These may include lead management, resource management, email marketing, and analytics solutions.
Current state of the market
The global market for digital marketing software is predicted to reach a size of $264.15 billion by 2030, with a CAGR of 19.4% from 2023 onward. Key players in this sector include HubSpot, Salesforce, and Mailchimp.
If you focus solely on the marketing automation segment, the market size is expected to grow from $5.75 billion in 2023 to $13.48 billion by 2028. That’s because automation is a big driver of growth, as more businesses realize the benefits of automating repetitive tasks to focus on customer-centric marketing.
56% of companies are currently using marketing automation, with 40% planning to adopt the technology. The rise in automation also correlates with another growth driver: The increasing need for marketers to study consumer behavior and personalize messaging accordingly.
That means tapping into big data and capturing real-time information, which often requires AI-powered tools. SaaS vendors are, therefore, increasingly including AI in their offering, typically as part of an all-in-one platform for maximum convenience.
Looking ahead
Due to online privacy issues, Google plans to phase out third-party cookies on Chrome, while Firefox and Safari have already done so. This makes it harder to know what your customers want, which is a challenge for your business as well as for the users (fellow marketers) of your SaaS product.
We already mentioned AI, and this technology is set to get even smarter. Along with machine learning, it’ll help marketers make sense of the growing mountain of data from multiple channels. Social media marketing is also on the rise, so you’ll need to tailor your SEO for these channels.
Do you know your competitors?
If you’re a SaaS business in the marketing industry, you probably have a good idea of who your main competitors are. But which ones should you focus on when it comes to comparing SEO strategies?
What you need is a Share of Value Graph. This gives you a much broader perspective, and allows you to see exactly who’s dominating in your niche. Thanks to the visual format, it’s easy to understand and interpret the results.
Share of Value
A Share of Value graph is a visual representation of where your competitors are ranking in the SERPs for a specific set of keywords related to your niche. The data shows the proportion of monthly organic search value—which we refer to as “traffic value”—captured by each domain.
How do we find the traffic value of a keyword?
Total monthly traffic x Estimated average cost per click = Monthly traffic value
So, if the keyword “email personalization” has 5700 monthly clicks and a CPC of $12:
5700 x $12 = traffic value of $68,400.
To produce the SoV graph, we take the monthly traffic value and divide it between the domains in the SERPs that are ranking highest for this keyword. The higher the ranking, the bigger the domain’s share of traffic value. This highlights the opportunity in front of your own domain.
The graph measures each domain’s position across a number of keywords, and also links those positions to actual ROI. From this, you can see the amount you’d otherwise have had to spend on PPC.
Marketing SaaS Share of Value
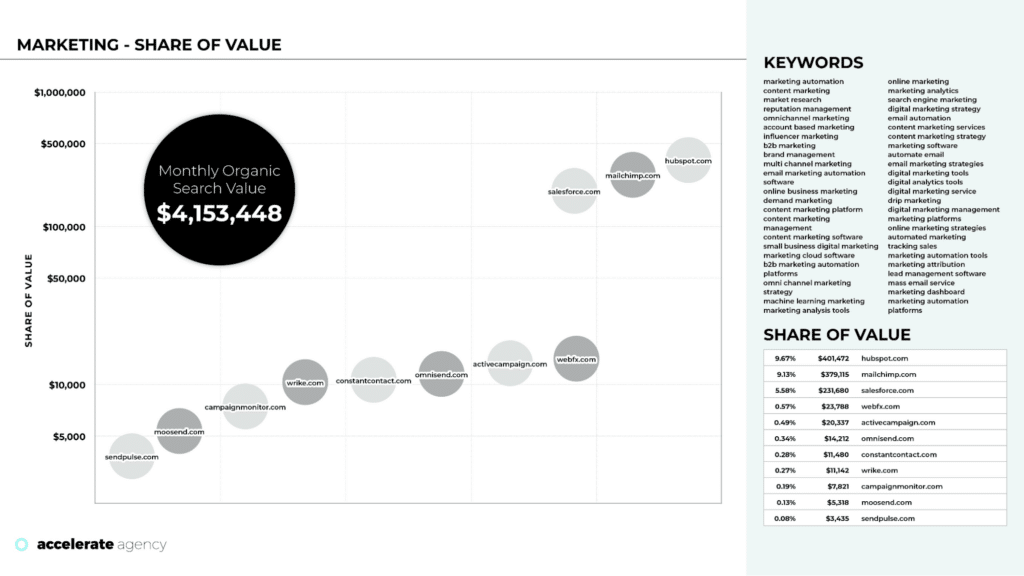
Our focus here is on the marketing SaaS sector, so that’s what we’re looking at in this Share of Value bubble. As you can see, it encompasses all the key companies in this niche.
First of all, we considered a wide array of keywords relating to marketing and software, such as “omnichannel marketing”, “brand management”, and “digital marketing strategy”. The combined monthly organic search value for the top 11 competitors was $4,153,448.
We then looked at the revenue for these companies, and plotted them on the graph accordingly. The individual Shares of Value for each domain are shown to the right of the graph.
While the SoV graph reveals who’s getting the lion’s share, it can’t tell you how the top companies are making the most of SEO. You need to look closely at the details of their success—which is where a Single Page Analysis comes in (more on that later).
Who is currently doing well?
Even a quick glance at the SoV graph tells you that three companies—HubSpot, Mailchimp, and Salesforce—are the clear leaders of the pack. The top two are quite closely matched, with Salesforce not too far behind.
HubSpot is in top spot, having captured $401,472 in monthly organic value for the keywords we used. That represents 9.67% of the SERPs. Mailchimp claims 9.13% and $379,115, while Salesforce is at 5.58% and $231,680. The rest of the top competing domains are much lower, all with 0.57% or below.
These challengers include Wrike, ConstantContact, and Omnisend. It’s also interesting to see WebFX, a marketing agency, very much in the mix.
Why are those in the top positions doing so well? Authority plays a big part, but it’s the size and scale of their content strategies that puts them so far in front. These are backed by enormous link-building campaigns. In other words, their success is partially down to the scale of the available resources.
Single Page Analysis
A Single Page Analysis (SPA) focuses on a target page from your website, and compares it to those of your competitors. The evaluation is based on SEO ranking factors, and provides a visual comparison of domains within the top 10 SERP positions.
Not only can you see who’s dominating the industry from an SEO perspective, you can also find out why they’re dominant—and measure efficient ROI gains within target keyword lists. SEOs can use the SPA to understand and evaluate:
- Factors affecting ranking potential
- The resources required to make the target page rank competitively (and if there’s ROI in upping your ranking for that keyword).
SPA involves a granular analysis of one of the keywords from the SoV graph. Our team looks at content, links, and technical SEO, to build a full picture of the domain’s performance. For example, as well as considering internal links, we analyze the number of in-content links among them.
Single Page Analysis of “content marketing software” (marketing)
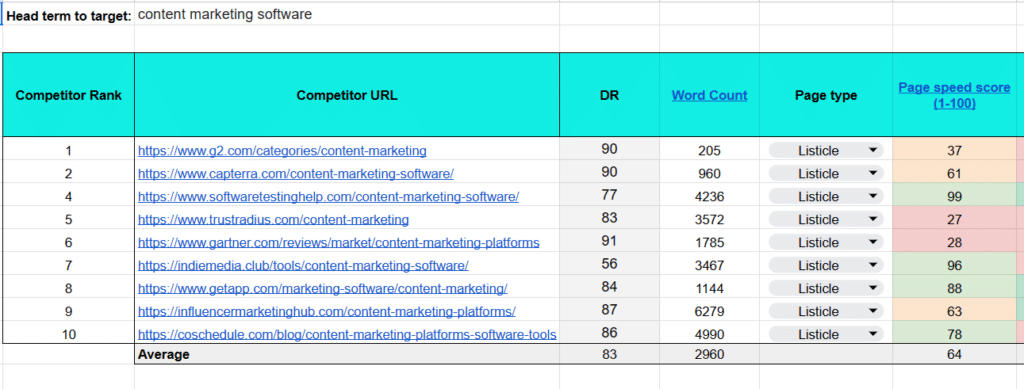
For this single page analysis, we chose the keyword “content marketing software”. The table shows the top nine domains currently ranking for this keyword, and highlights the key SEO factors that have put them there.
The first thing to spot is that every page in the SPA is a listicle, so your target page is not going to make the top positions unless the content is in listicle format. The first eight domains on the list are software review sites, topped by G2 and Capterra.
Word counts vary quite widely, with G2 producing only 205 words and InfluencerMarketingHub on 6279. That gives us an average of 2960. Most of the domains have a very high domain rating (DR), which is helping them to rank highly.
The other factor that stands out in this SPA is internal links. G2 has included a massive 13450 internal links, of which 34 are in-content links. TrustRadius has gone even further with 31772 internal links, although Capterra (position #2) has zero.
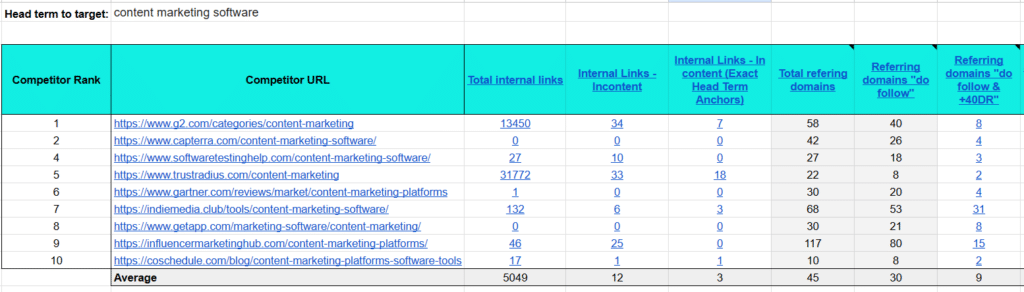
When it comes to referring domains, though, the figures are lower. For referring domains with >40 DR, the average is nine. Link velocity is low, too.
How much to rank in the top 3 for “content marketing software”?
So, taking all the above data into account, what do you need to do for your target page to appear in the top three positions?
Site authority is a major factor. The domains featured in our SPA have high authority, and so do the top competitors on the Share of Value graph.
As we mentioned, listicles are the dominant content type, and you should aim for around 4000 words to boost your ranking. Your content needs between five and 30 links from domains with DR +40, depending on authority.
Good internal linking is also a must, including in-content links. If you can match or outshine your competitors in these areas, your own DR will rise—which is an important factor for this keyword.
Marketing SoV takeaways
Before we explain more about the key metrics we use in the single page analysis, let’s go over the main SEO takeaways from the SPA and the SoV graph.
Basically, the data tells us that it’s going to be very difficult to rank without a DR above 75. The ability to get into the top positions is very dependent upon the authority of the site. Of course, you can boost your authority with SEO factors like long-form content and link-building.
In this niche, you’re promoting your SaaS product to fellow marketers, who will be able to spot short-cuts and “black hat” techniques like bought links—so make sure you put time and effort into SEO and ensure your content is genuinely informative, unique, and engaging.
Key metrics and why they are important
Our SPA looks at a wide range of key metrics for technical, onsite, and offsite SEO, from word count, to page speed, to branded anchor ratio.
All of these have an impact on rankings. Analysis of the highest-ranking pages shows what they’re doing right, and what you need to do to get ahead.
Let’s define each of the metrics and explain their importance:
SERP rank position
Definition: A page’s ranking based on its appearance on the SERP results.
Importance: The higher a page ranks, the more organic traffic it will receive. Searchers very rarely venture beyond page one, and pages in the top three positions get the lion’s share of clicks.
DR
Definition: Stands for Domain Rating, and is a ranking score up to 100, determining a site’s authority in the eyes of SEO tools like Ahrefs.
Importance: DR demonstrates the relative strength of a website’s backlink profile. It can be useful for assessing the viability of competing for the same keywords as a rival’s site and in judging domains as potential backlink sources.
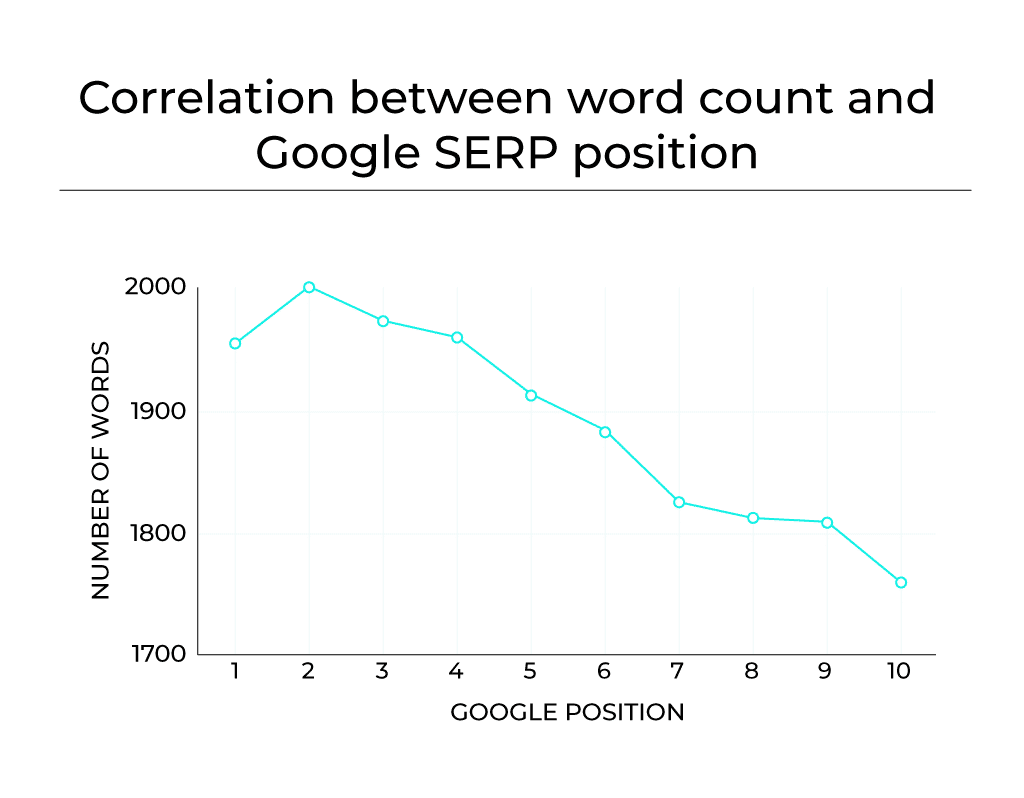
Word count
Definition: The number of words in an article/page.
Importance: Word count isn’t a specific ranking factor, but longer-form content does tend to rank better. The more content, the easier it is for search engines to understand what a page is about. Longer-form content (as long as it’s relevant and useful) also provides a better user experience.
Page type
Definition: Type of page depending on content (e.g., informational, listicle, features).
Importance: Understanding different page types helps you ensure the page is correctly tailored to its audience and their search intent. For instance, a listicle page would suit those looking to compare products but not top-of-funnel searchers wanting general information.
Page speed score (1-100)
Definition: An automated score showing how fast the page’s contents are displayed.
Importance: Page speed is increasingly crucial to SEO. Slow loading pages provide a poor user experience and typically have high bounce rates (searchers won’t wait long). Both those things negatively impact ranking.
Web Vitals status
Definition: Google’s assessment of a page’s overall technical performance, as measured within Google Search Console.
Importance: Web Vitals status is a quantitative measure of the site’s technical performance and, therefore, its user experience.
Total internal (keyword anchor)
Definition: Determined using Ahrefs, this is the total number of dofollow internal backlinks with the target keyword as the anchor.
Importance: This metric helps you assess your general internal linking strategy. When you link to another page on your site, you give that page link authority. Therefore, your best performing pages should have more links to the pages you most want to rank.
Total in content links
Definition: Total number of internal backlinks inserted in content.
Importance: This metric helps you assess your general internal linking strategy. When you link to another page on your site, you give that page link authority. Therefore, your best performing pages should have more links to the pages you most want to rank.
Internal links
Definition: Total number of internal backlinks.
Importance: Internal links aren’t always found within your pages’ content—they also include navigation links, footer links, and more. These also impact UX and how easy your site is to crawl, so it’s important to track and review these links, too.
Total referring domains
Definition: Total number of domains that are giving backlinks to a specific page.
Importance: This is a critical SEO metric. The more (high-quality) referring domains that link to your site, the greater the signal sent to a search engine that your content is trustworthy, valuable, and relevant.
Total dofollow referring domains
Definition: Total number of domains giving dofollow backlinks to a specific page.
Importance: Dofollow backlinks pass on authority from the referring website, while nofollow links do not. Therefore, it’s important to understand the ratio between those types of links, which this metric makes possible.
Total dofollow links +40DR
Definition: Total number of domains giving dofollow backlinks with a DR of >40.
Importance: A dofollow link from a site with a higher domain rating (DR) is more valuable than one with a lower DR. That makes it important to track your dofollow links from those higher authority domains, as well as the total number of links.
New links acquired in last 6 months (+40DR)
Definition: Total number of dofollow backlinks acquired within the last six months from domains with +40DR.
Importance: This helps you to track the growth rate of your backlink profile, which can be important when assessing and tweaking outreach strategy.
Link velocity p/m
Definition: Average number of dofollow backlinks that a page is acquiring per month.
Importance: In general, a higher and increasing link velocity suggests that a page is more popular and respected.
Total dofollow backlinks
Definition: Total number of backlinks that are dofollow.
Importance: Very similar to the total dofollow referring domains metric, it’s important to measure the number of dofollow backlinks to understand the authority being passed to your site.
Head term exact match
Definition: Total number of backlinks with the exact head term as anchor.
Importance: Anchor text is a ranking factor, so it’s useful to track the number of backlinks using the exact head term your page is targeting, especially in concert with the “head term exact match ratio” metric (see below).
Head term exact match ratio (%)
Definition: The ratio for how many times the head term has been used as an anchor within the entire backlink profile.
Importance: While exact match anchors are useful, an excessive amount may be viewed negatively by search engines as potentially spammy or manipulated links. It’s useful, therefore, to track the ratio of head term exact match anchors in your backlink profile.
Branded anchors
Definition: Total number of backlinks with the domain’s brand as anchor.
Importance: Branded anchor text is important for building brand recognition online and ensuring a balanced backlink profile.
Branded anchor ratio (%)
Definition: The ratio for how many times the brand is used as an anchor within the entire backlink profile.
Importance: In a similar vein to the above “head term exact match ratio” metric, this one’s importance lies in how it helps you to assess the overall balance of your backlink profile.
How key metrics can be measured/which tools can be used
As you can see, there are a lot of metrics you need to measure. The good news is, there are plenty of tools you can use.
For example, Google Search Console incorporates various SEO tools including PageSpeed Insights, Core Web Vitals, and a Links Report.
One of our favorites is Ahrefs, which provides a host of tools including a domain authority checker and a rank tracker for monitoring your rankings over time and against your competitors. It also measures referring domains and dofollow links.
Other well-known tools include Semrush (which also measures Core Web Vitals, internal linking, and page loading speeds) and Moz, which helps you gather link metrics including page authority and backlink numbers.
To make life easier, we’ve put together a table of tools that can be used to measure the key metrics:
| METRIC | TOOLS |
| SERP rank position | Ahrefs |
| DR | Ahrefs |
| Word Count | https://wordcounter.net/ |
| Page Type | na |
| Page Speed Score (1-100) | https://pagespeed.web.dev/ |
| Web Vitals Status | https://pagespeed.web.dev/ |
| Total Internal (keyword anchor) | Ahrefs |
| Total In Content links | Ahrefs |
| Total Internal Links | Ahrefs |
| Total referring domains | Ahrefs |
| Total do follow referring domains | Ahrefs |
| Total do follow links +40DR | Ahrefs |
| New links acquired in last 6 months (+40DR) | Ahrefs |
| Link velocity p/m | na |
| Total do follow backlinks | Ahrefs |
| Head term exact match | Ahrefs |
| Branded anchors | Ahrefs |
| Head term exact match ratio (%) | na |
| Branded anchor ratio (%) | na |