SaaS SEO Guide
Share of Value for the Ecommerce Niche
Book a FREE SEO Strategy Consultation >
Further Reading:
- SaaS SEO Strategy
- SaaS SEO Checklist
- SaaS Technical SEO
- SaaS SEO Audit
- SaaS Keyword Research
- SaaS SEO Content
- SaaS SEO Copywriting
- E-A-T for SaaS
- Enterprise SaaS SEO
- SaaS SEO Metrics and KPI's
- SaaS SEO Attribution
- VOIP and Telecommunications SEO Strategy
- SaaS Link Building
- Payroll and Finance SaaS SEO
- SaaS SEO Agency
- SaaS Link Building Agency
The more competitive your industry, the more important it is to keep track of your rivals and what they’re doing right. With increasing competition in the ecommerce SaaS sector, good SEO is a key differentiator.
You need to know who’s getting traffic for relevant keywords, and why—and you can find this out by visualizing your competitors on a Share of Value graph. Not sure what Share of Value means or how it relates to SEO? You’re in the right place.
Introduction to ecommerce SaaS
Ecommerce SaaS is a type of Software-as-a Service aimed at anyone who sells products online. Instead of installing the software on their own premises, businesses take out a subscription with the vendor and pay a monthly or annual fee.
Users access the app or platform via the internet, and the vendor is fully responsible for maintenance, updates, and security. The software typically offers all the features you need to run an online store, including inventory management, fulfillment, and reverse logistics.
Current state of the market
The big players in the market are retail platforms such as Shopify and BigCommerce, and ecommerce management solutions such as Brightpearl, Oberlo, and ShipBob. The global market size for ecommerce SaaS was $6.1 billion in 2021, and it’s expected to reach $14.5 billion in 2027.
What are the current growth drivers? As usual, we have to mention COVID. Online shopping was already popular, but the pandemic accelerated it massively and there’s no turning back. Today, ecommerce is increasingly used for B2B sales as well as B2C.
The associated rise in remote work has also led to widespread SaaS and cloud adoption, as businesses need to be able to access their systems from anywhere. They appreciate managed solutions that make it simple to run an online store, but still require a level of customization and integrations with other tools.
As with all SaaS sectors, security remains a key challenge. Ecommerce firms are handling a ton of customer information, including payment data, and need to know that the software vendor can keep it safe. $41 billion was lost to ecommerce fraud worldwide in 2022.
Another challenge is the growth of PaaS (Platform as a Service), which allows customers to develop new applications themselves. To compete, SaaS vendors will have to be more innovative and tailor their solutions to specific verticals.
Looking ahead
Although the popularity of ecommerce continues to grow, that growth is slowly leveling out. With fewer new customers to target—and customer expectations continuing to rise—ecommerce SaaS vendors will need to do more to retain existing subscribers.
Mobile ecommerce is also on the up, with sales expected to account for $710 billion of all commerce sales by 2025. SaaS vendors will have to ensure their offering is mobile-friendly.
Globalization means that cross-border shopping is set to increase. It’s vital to factor this into your SEO efforts, including keywords aimed at different regions, accurate translations of your content, and pricing in various currencies.
Do you know your competitors?
You can probably name several of the big players in ecommerce SaaS, but it’s worth looking at the actual numbers to find out who ranks where in terms of market value.
A Share of Value Graph lets you do just that, by looking at the niche from a much broader perspective. That way, you’ll know who to focus on when comparing SEO strategies.
Share of Value
A Share of Value graph reveals the proportional monthly organic search value for a set of keywords relating to your niche. It shows where various domains—namely those of your rivals—are ranking for these keywords.
We call this their “traffic value”. When you visualize this against your top competitors for a particular keyword, it helps you to recognize the opportunity in front of your own domain.
We use this formula to find the traffic value of a keyword:
Total monthly traffic x Estimated average CPC = Monthly traffic value
For instance, imagine the keyword “inventory management” has 9200 monthly clicks and a cost per click of $13:
9200 x $13 = traffic value of $119,600.
The next step is to create the SoV graph. We divide the above figure between the domains in the SERP that are ranking for this keyword—with higher rankings correlating to a higher share of traffic value.
As well as measuring each domain’s position across a number of keywords, the graph also links those positions to actual ROI. This shows the amount you’d have had to spend on PPC instead of organic traffic.
Ecommerce SaaS Share of Value
For our purposes, we’re focusing on the specific Share of Value bubble for companies in the ecommerce SaaS sector. We’ve included all the major vendors in this niche.
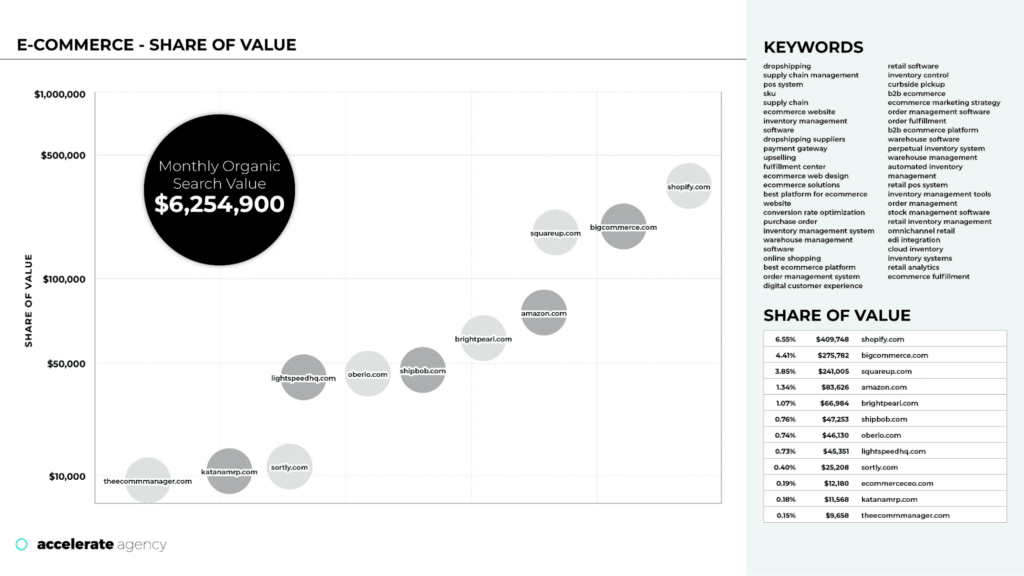
We examined a large selection of keywords relating to ecommerce, such as “ecommerce solutions”, “dropshipping”, and “order management”. The combined monthly organic search value for the top nine competitors was $6,254,900.
To display this information visually, we plotted these companies on the graph according to their revenue. You can view their individual shares to the right of the graph.
This is a great starting point for monitoring your competitors, but it doesn’t reveal why they’re doing well in terms of SEO. A Single Page Analysis provides a much closer look, and we’ll show you how to conduct one a little later on in the article.
Who is currently doing well?
Take a look at the SoV graph and you can see that the leaders in ecommerce SaaS are Shopify, BigCommerce, and SquareUp. Their challengers include Brightpearl, Shipbob, Oberlo, and Lightspeed HQ, although they’re all some way behind the top three.
Shopify is currently the clear winner, claiming a 6.55% Share of Value. The monthly organic value of the keywords they have captured is $409,748. BigCommerce and SquareUp have 4.41% and 3.84% respectively.
So, how come Shopify is doing so well? Firstly, it’s one of the most authoritative sites in the world with a domain rating (DR) of 95. Secondly, it knows the importance of backlinks—and is supported by an enormous backlink profile of around half a billion links.
Shopify also benefits from excellent internal linking, directing authority to pages that drive the most valuable traffic. The site structure is incredibly detailed and well maintained, as well as being built on complex hub and spoke models.
Single Page Analysis
A Single Page Analysis (SPA) is a visual comparison of your target page with those of competitors within the top 10 SERP positions. Specifically, it shows how you compare based on SEO ranking factors.
To run the analysis, you pick one of the keywords from the SoV graph and look at it on a more granular level. At accelerate agency, we factor in content, links, and technical SEO, rather than focusing on just one element. For instance, we look at page speed score and web vitals as well as word count and page type.
The SPA will help you see who’s dominating the industry from an SEO perspective, uncover the reasons why your main competitors are successful, and measure efficient ROI gains within target keyword lists.
In short, a single page analysis enables SEOs to assess and understand the following:
- The factors that affect ranking potential
- The resources you’d need to make the target page rank competitively (and if there’s ROI in boosting your ranking for that keyword).
Single Page Analysis of “retail inventory management” (e-commerce)
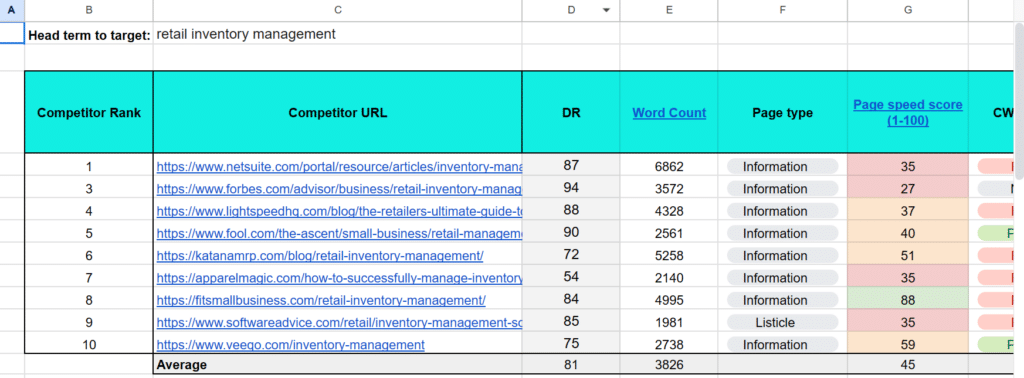
This Single Page Analysis focuses on a particular keyword from the Share of Value graph. The table shows nine companies who are currently ranking for “retail inventory management”. In terms of direct competitors, NetSuite and Lightspeed are the ones to watch.
All but one of the pages in the top SERP positions are informational, so that’s the type of content you should be producing. What’s distinguishing those at the top is their word count and their links. Word counts are on the high side—the average for the top 10 is 3826, and the top-ranked page (NetSuite) comes in at 6862.
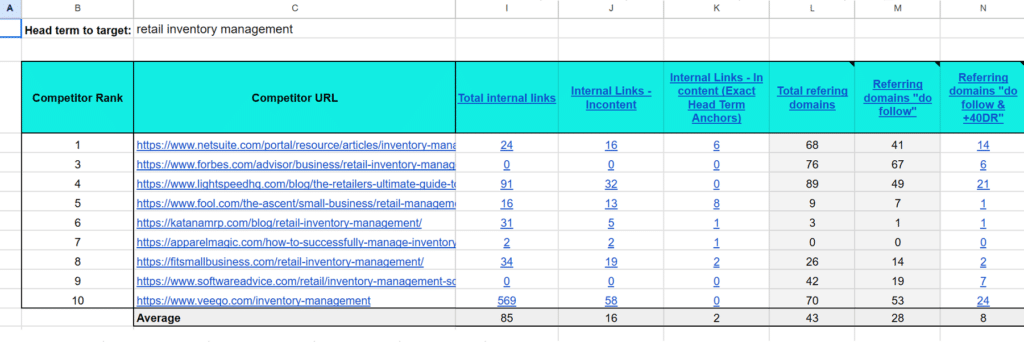
Those in the top positions are also well above the average for total referring domains, including domains with >40 DR. There are a lot of in-content internal links—for Lightspeed, 32 of its 91 total internal links are of the in-content variety, while Veeqo has 58.
NetSuite’s links are okay, but a number of search engines are regional URLs. Lightspeed has a decent number of links, but not all of them are good. We can also see evidence of bought links.
How much to rank in the top 3 for “retail inventory management”?
Using the data from the SPA, we can determine the estimated requirements for ranking in the top three for “retail inventory management”.
Firstly, we can see that you’re going to need high authority to rank well for this keyword. The average DR of the top ranked pages is 81, which is very high.
Backlinks from high DR referring domains are a must, too. Lightspeed has do-follow links from 21 referring domains with >40 DR, and NetSuite has 14—the top 10 average being eight. We’d say, therefore, that you’ll need to shoot for 15-20, if you can get them.
In terms of content, you’re aiming for long-form informational articles with a word count of 5000 to 6000. Internal linking is also important; as we said, it’s one of Shopify’s key strengths in this niche (even if they aren’t actually ranking for this particular keyword). It’s worth considering the head term exact match ratio, too, as NetSuite’s is 3.49% while almost all the rest are zero.
Ecommerce SoV takeaways
So, what are the main SEO takeaways from the share of value graph and single page analysis?
Focusing on “retail inventory management”, this keyword is informational with low intent, and only yields low traffic. It would also be incredibly expensive to rank for this keyword, so you have to ask yourself if it’s worth even trying to.
You might be better off spending the money elsewhere. Fortunately, ecommerce is such a diverse niche that there are plenty of other keywords you could try.
Key metrics and why they are important
Our SPA looks at a wide range of key metrics for technical, onsite, and offsite SEO, from word count, to page speed, to branded anchor ratio.
All of these have an impact on rankings. Analysis of the highest-ranking pages shows what they’re doing right, and what you need to do to get ahead.
Let’s define each of the metrics and explain their importance:
SERP rank position
Definition: A page’s ranking based on its appearance on the SERP results.
Importance: The higher a page ranks, the more organic traffic it will receive. Searchers very rarely venture beyond page one, and pages in the top three positions get the lion’s share of clicks.
DR
Definition: Stands for Domain Rating, and is a ranking score up to 100, determining a site’s authority in the eyes of SEO tools like Ahrefs.
Importance: DR demonstrates the relative strength of a website’s backlink profile. It can be useful for assessing the viability of competing for the same keywords as a rival’s site and in judging domains as potential backlink sources.
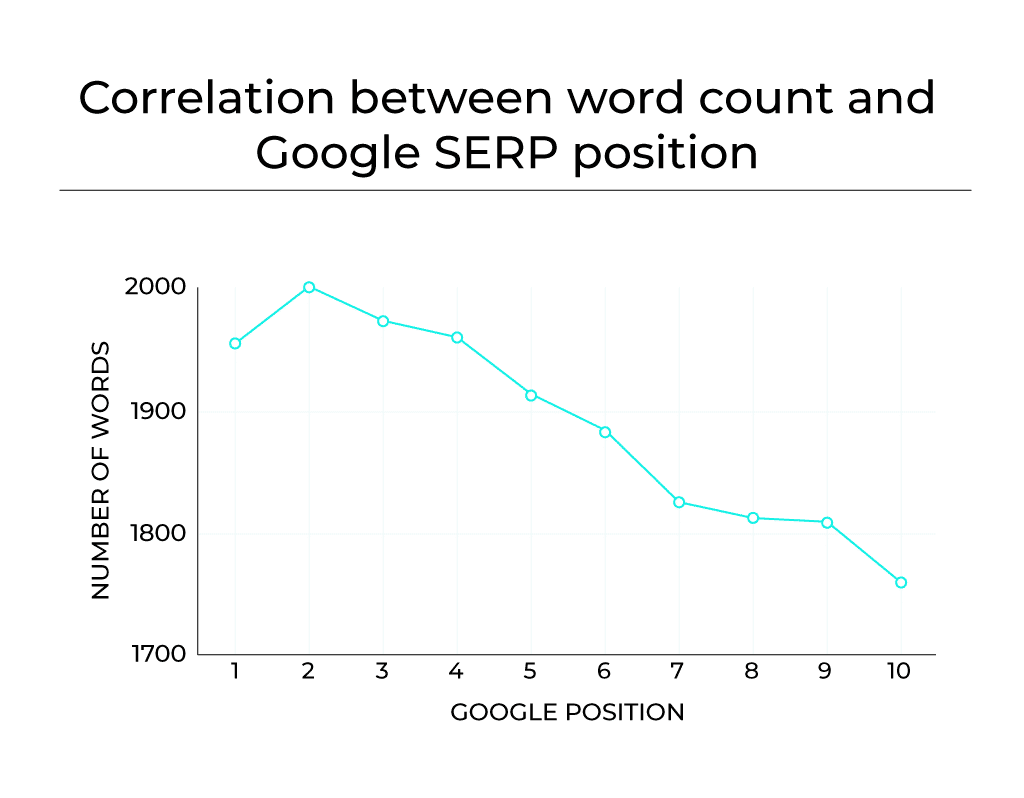
Word count
Definition: The number of words in an article/page.
Importance: Word count isn’t a specific ranking factor, but longer-form content does tend to rank better. The more content, the easier it is for search engines to understand what a page is about. Longer-form content (as long as it’s relevant and useful) also provides a better user experience.
Page type
Definition: Type of page depending on content (e.g., informational, listicle, features).
Importance: Understanding different page types helps you ensure the page is correctly tailored to its audience and their search intent. For instance, a listicle page would suit those looking to compare products but not top-of-funnel searchers wanting general information.
Page speed score (1-100)
Definition: An automated score showing how fast the page’s contents are displayed.
Importance: Page speed is increasingly crucial to SEO. Slow loading pages provide a poor user experience and typically have high bounce rates (searchers won’t wait long). Both those things negatively impact ranking.
Web Vitals status
Definition: Google’s assessment of a page’s overall technical performance, as measured within Google Search Console.
Importance: Web Vitals status is a quantitative measure of the site’s technical performance and, therefore, its user experience.
Total internal (keyword anchor)
Definition: Determined using Ahrefs, this is the total number of dofollow internal backlinks with the target keyword as the anchor.
Importance: This metric helps you assess your general internal linking strategy. When you link to another page on your site, you give that page link authority. Therefore, your best performing pages should have more links to the pages you most want to rank.
Total in content links
Definition: Total number of internal backlinks inserted in content.
Importance: This metric helps you assess your general internal linking strategy. When you link to another page on your site, you give that page link authority. Therefore, your best performing pages should have more links to the pages you most want to rank.
Internal links
Definition: Total number of internal backlinks.
Importance: Internal links aren’t always found within your pages’ content—they also include navigation links, footer links, and more. These also impact UX and how easy your site is to crawl, so it’s important to track and review these links, too.
Total referring domains
Definition: Total number of domains that are giving backlinks to a specific page.
Importance: This is a critical SEO metric. The more (high-quality) referring domains that link to your site, the greater the signal sent to a search engine that your content is trustworthy, valuable, and relevant.
Total dofollow referring domains
Definition: Total number of domains giving dofollow backlinks to a specific page.
Importance: Dofollow backlinks pass on authority from the referring website, while nofollow links do not. Therefore, it’s important to understand the ratio between those types of links, which this metric makes possible.
Total dofollow links +40DR
Definition: Total number of domains giving dofollow backlinks with a DR of >40.
Importance: A dofollow link from a site with a higher domain rating (DR) is more valuable than one with a lower DR. That makes it important to track your dofollow links from those higher authority domains, as well as the total number of links.
New links acquired in last 6 months (+40DR)
Definition: Total number of dofollow backlinks acquired within the last six months from domains with +40DR.
Importance: This helps you to track the growth rate of your backlink profile, which can be important when assessing and tweaking outreach strategy.
Link velocity p/m
Definition: Average number of dofollow backlinks that a page is acquiring per month.
Importance: In general, a higher and increasing link velocity suggests that a page is more popular and respected.
Total dofollow backlinks
Definition: Total number of backlinks that are dofollow.
Importance: Very similar to the total dofollow referring domains metric, it’s important to measure the number of dofollow backlinks to understand the authority being passed to your site.
Head term exact match
Definition: Total number of backlinks with the exact head term as anchor.
Importance: Anchor text is a ranking factor, so it’s useful to track the number of backlinks using the exact head term your page is targeting, especially in concert with the “head term exact match ratio” metric (see below).
Head term exact match ratio (%)
Definition: The ratio for how many times the head term has been used as an anchor within the entire backlink profile.
Importance: While exact match anchors are useful, an excessive amount may be viewed negatively by search engines as potentially spammy or manipulated links. It’s useful, therefore, to track the ratio of head term exact match anchors in your backlink profile.
Branded anchors
Definition: Total number of backlinks with the domain’s brand as anchor.
Importance: Branded anchor text is important for building brand recognition online and ensuring a balanced backlink profile.
Branded anchor ratio (%)
Definition: The ratio for how many times the brand is used as an anchor within the entire backlink profile.
Importance: In a similar vein to the above “head term exact match ratio” metric, this one’s importance lies in how it helps you to assess the overall balance of your backlink profile.
H2: How key metrics can be measured/which tools can be used
As you can see, there are a lot of metrics you need to measure. The good news is, there are plenty of tools you can use.
For example, Google Search Console incorporates various SEO tools including PageSpeed Insights, Core Web Vitals, and a Links Report.
One of our favorites is Ahrefs, which provides a host of tools including a domain authority checker and a rank tracker for monitoring your rankings over time and against your competitors. It also measures referring domains and dofollow links.
Other well-known tools include Semrush (which also measures Core Web Vitals, internal linking, and page loading speeds) and Moz, which helps you gather link metrics including page authority and backlink numbers.
To make life easier, we’ve put together a table of tools that can be used to measure the key metrics:
| METRIC | TOOLS |
| SERP rank position | Ahrefs |
| DR | Ahrefs |
| Word Count | https://wordcounter.net/ |
| Page Type | na |
| Page Speed Score (1-100) | https://pagespeed.web.dev/ |
| Web Vitals Status | https://pagespeed.web.dev/ |
| Total Internal (keyword anchor) | Ahrefs |
| Total In Content links | Ahrefs |
| Total Internal Links | Ahrefs |
| Total referring domains | Ahrefs |
| Total do follow referring domains | Ahrefs |
| Total do follow links +40DR | Ahrefs |
| New links acquired in last 6 months (+40DR) | Ahrefs |
| Link velocity p/m | na |
| Total do follow backlinks | Ahrefs |
| Head term exact match | Ahrefs |
| Branded anchors | Ahrefs |
| Head term exact match ratio (%) | na |
| Branded anchor ratio (%) | na |